

Getting started
Usage logs
Where to see the model, token usage and cost of every call, and how to check what a call cost you.
Every request made with one of your API keys leaves a record in Usage Logs: which key, which model, how many tokens and how much it cost. Start here to reconcile charges, troubleshoot problems or track down unexpected costs.
Open the usage logs
Section titled “Open the usage logs”After signing in, click Usage Logs under General in the console sidebar. The page title is Common Logs.
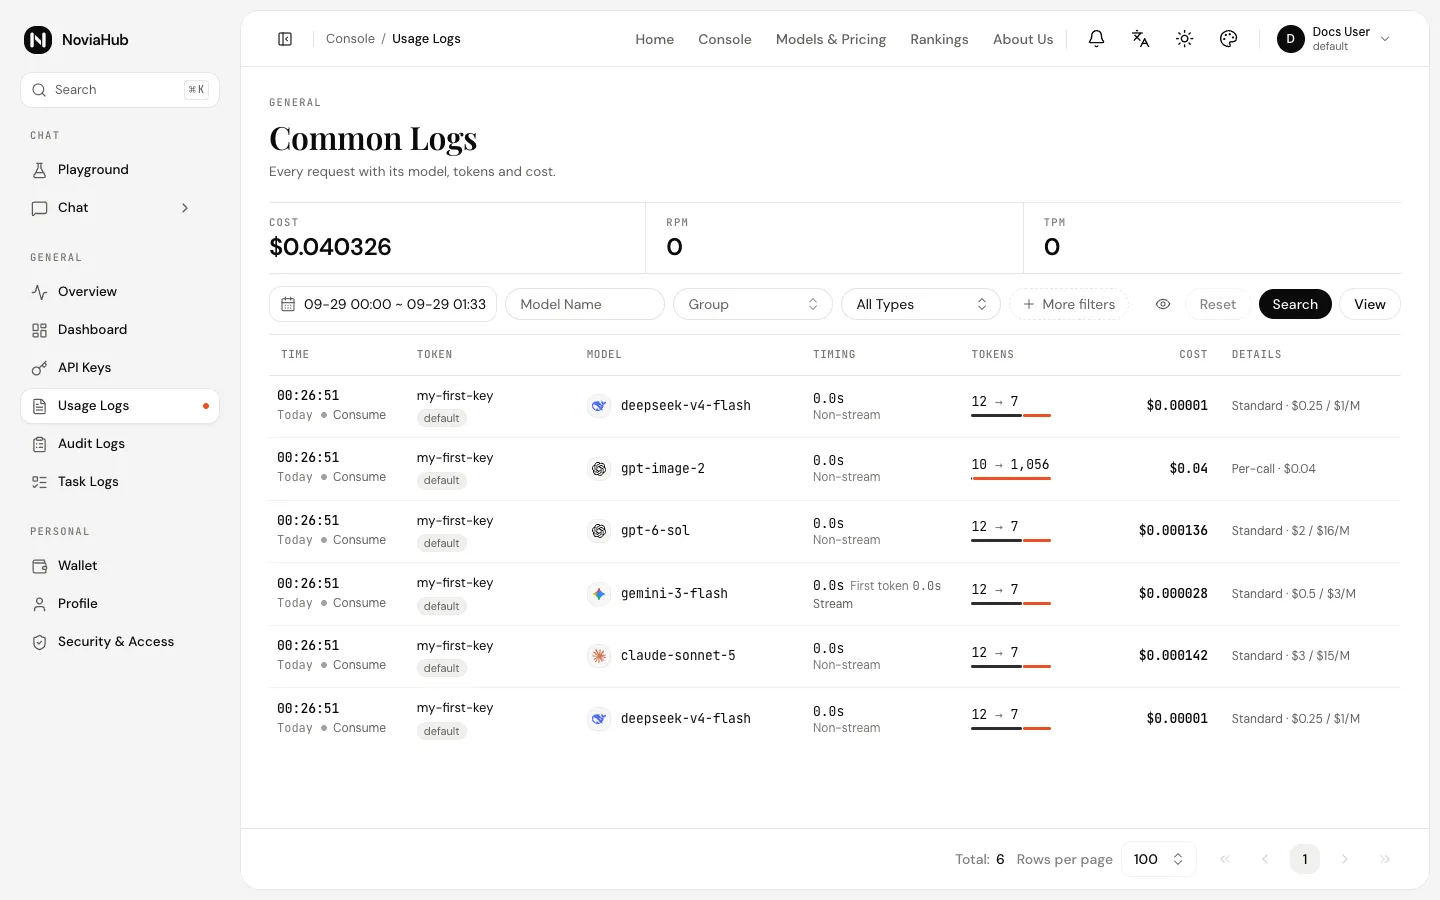
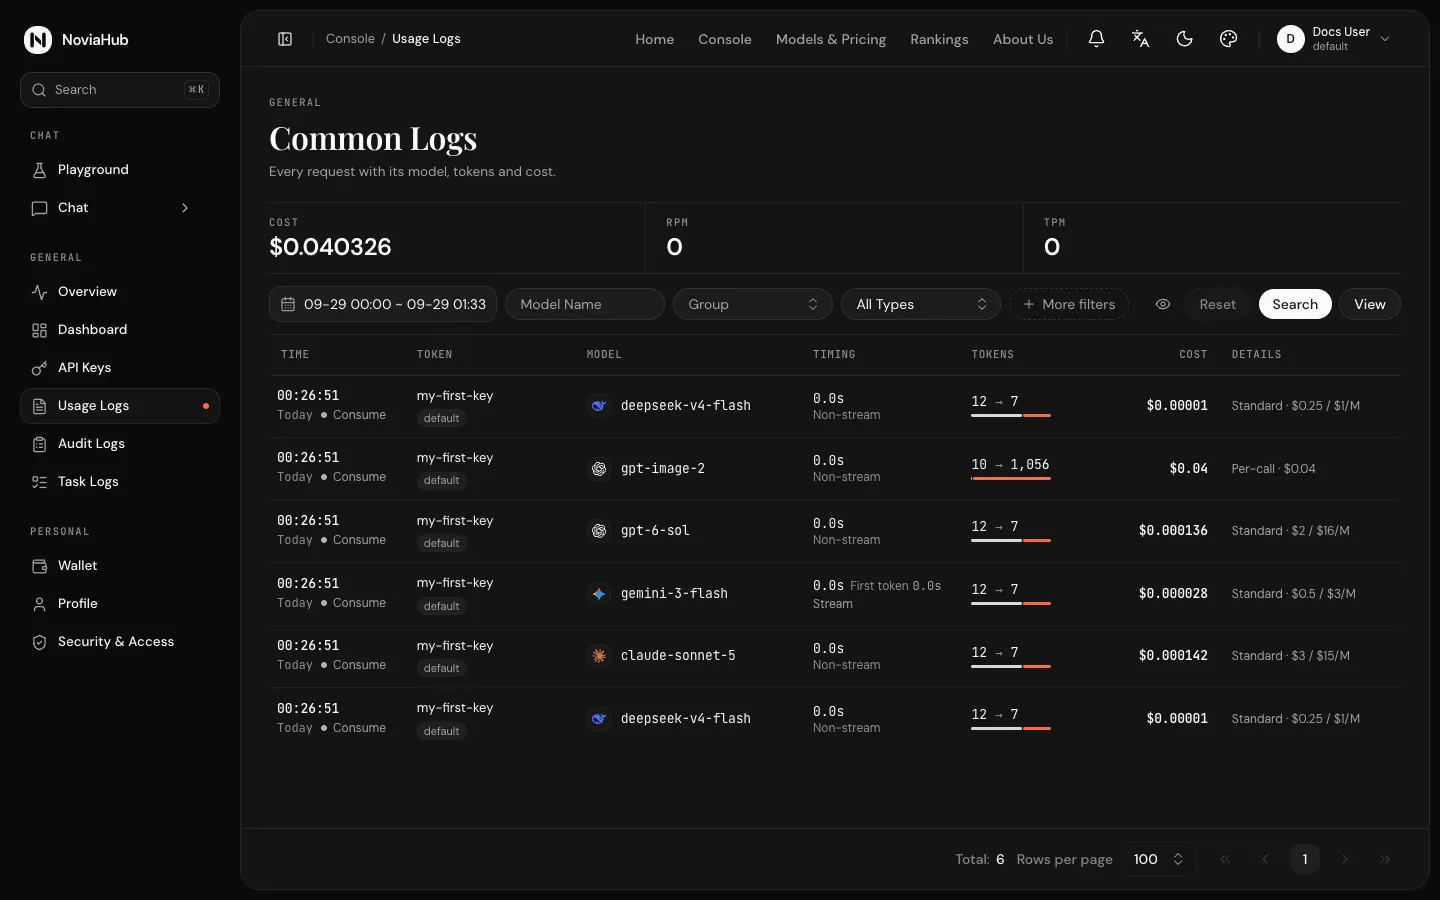
Top of the page
Section titled “Top of the page”| Item | Meaning |
|---|---|
| Cost | Total cost of all calls matching the current filters. |
| RPM | Requests per minute. |
| TPM | Tokens per minute. |
Filtering
Section titled “Filtering”- Time range: the date box on the left, today from 00:00 until now by default. To see older records, change the start and end times here first.
- Model Name: show calls to one model only.
- Group: filter by group.
- Type: All Types by default; you can show only Consume (charged calls), Top-up, Refund, Error and so on.
- More filters: filter by Token Name (the name of the API key) or Request ID.
Click Search to apply the filters and Reset to clear them. The eye icon next to the filters can Show or Hide some sensitive values; hide them before sharing a screenshot.
Table columns
Section titled “Table columns”| Column | Meaning |
|---|---|
| Time | When the request happened; the small text below is the record type, such as Consume. |
| Token | The name of the API key used, and its group. |
| Model | The model requested. |
| Timing | How many seconds the whole request took. Streaming requests also show First token, the time from sending the request to receiving the first token, and are marked Stream or Non-stream. |
| Tokens | Input → output tokens. Cache reads and writes are shown too when caching was used. |
| Cost | How much the call cost. |
| Details | A summary of the prices that applied: the name of the matched price tier followed by the input and output prices. For example, standard · $2 / $12/M means the standard tier at $2 per million input tokens and $12 per million output tokens (example figures only); cache prices are listed too when the cache was used. Click it to open Log Details. |
Details of one call
Section titled “Details of one call”Click Details on a row to open Log Details:
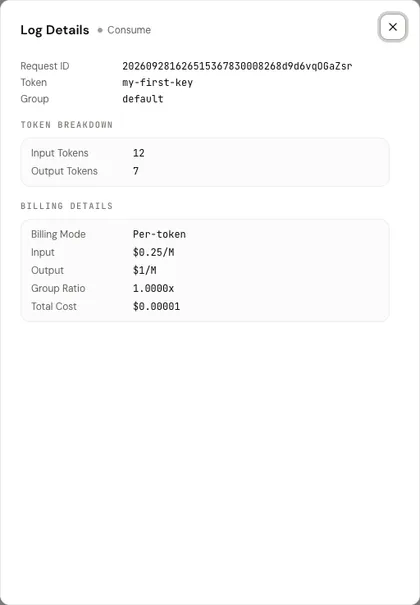
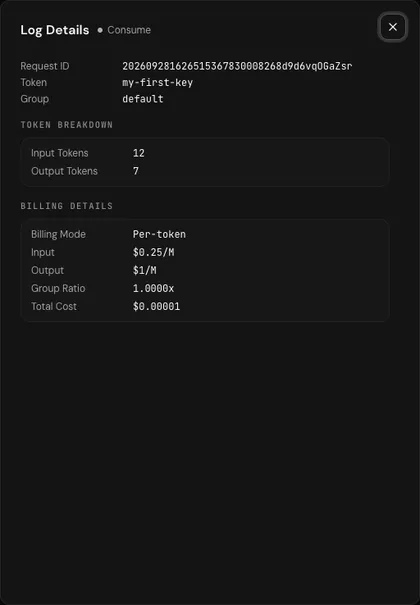
- Request ID: the unique ID of this request. Include it when you contact support. It is the same ID as in the
X-Oneapi-Request-Idresponse header, and the(request id: ...)at the end of an error message. - Token Breakdown: Input Tokens, Output Tokens and, when used, Cache Read, Cache Write, Image Tokens and so on.
- Billing Details: the Billing Mode (as of 2026-09-29 every model on production shows Dynamic Pricing; see Billing), the Matched Tier (which price tier applied), the input and output prices, the Group Ratio, cache prices, and the Total Cost.
Checking a charge yourself
Section titled “Checking a charge yourself”Take the record in the screenshot. It was made in a test environment with example prices, for illustration only. The test environment uses the older price settings, so the screenshot shows Billing Mode as Per-token; production shows Dynamic Pricing, but per-token pricing is calculated the same way:
- 12 input tokens at $0.25 per million tokens;
- 7 output tokens at $1 per million tokens;
- a group ratio of 1.0.
- Input: 12 ÷ 1,000,000 × $0.25 = $0.000003
- Output: 7 ÷ 1,000,000 × $1 = $0.000007
- Total: ($0.000003 + $0.000007) × 1.0 = $0.00001, which matches Total Cost.
Caching, images and per-call pricing change the calculation; see Billing. The actual price of each model is on the Models & Pricing page.
Common tasks
Section titled “Common tasks”- How much did one key spend? Under More filters, enter the key’s name in Token Name, set the time range you want, and read Cost at the top.
- Why did a call fail? Set Type to Error, find the record at the right time and open its details; include the Request ID when you contact support.
- Why did costs jump? Look at the Cost and Tokens columns for records with unusually many input or output tokens. The usual causes are a conversation history that keeps growing (each request sends the earlier conversation again) or asking the model for a very long output.